
Intro to LBO Modeling - What are Sources & Uses? (1 of 5)
Where is the money coming from, and where is it going?

LBO’s, short for leveraged buyouts, are the bread and butter of the M&A world. What is an LBO? It’s exactly what it sounds like - using leverage (i.e. debt) to buy out a company. The best parallel in everyday life is taking out a mortgage to buy a house - you buy the house despite only putting 5-20% of your own money down on the overall value of the home, and you pay the debt off over time. This is exactly what private equity buyers are doing - except they buy operating companies. By financing the transaction with a healthy level of debt, private equity buyers put less cash down and amplify their returns.
The LBO model outlines the transaction and typically includes 4-5 key things. This will be a 5-part series and we’ll cover each in an individual post.
Sources & Uses/Capitalization Table (today’s post)
3 Statement Model (P&L, Balance Sheet, Cash Flow Statement)
Operating Model (these are essentially the drivers underlying your revenue forecast, gross margins, operating expenses, etc., and level of detail varies dramatically here)
Cash Flow Model (these are the various schedules that feed into the 3 statements above)
Returns Summary (if you’re on the equity side) or Credit Statistics Summary (if you’re on the debt side)
With these 5 schedules, you can essentially model out the growth profile of a business, model out cash flows, and then toggle scenarios - high growth, moderate growth, no growth, downside case, etc., and view returns under each scenario.
These are then typically used to inform leverage levels if you’re in credit, or valuation if you’re on the equity side. Examples of questions you’ll hear on the credit side:
“Walk us through the downside case. What assumptions did you make?”
“Is this the appropriate amount of leverage? Fixed charge coverages look tight, especially in the downside.”
“Are we being too conservative in our cash flow assumptions?”
And on the equity side:
“The banker guided us to a >12x purchase price multiple to get a management meeting. Does that work from a returns perspective?”
“Are we being too aggressive in our growth case? Let’s haircut these assumptions.”
“This deal doesn’t make sense at this valuation.”
Essentially, the LBO model is the foundation of M&A and is a critical part of working in the industry. If you’re interviewing, it’s likely that you’ll be expected to build one from scratch (or populate a template) as part of a case study. So let’s jump into part 1 of this 5-part series, and by the end of it you’ll be building paper LBOs on cocktail napkins at the bar.
Sources & Uses - Step 1 of Building an LBO
All deals involves money changing hands, and the sources & uses schedule outlines exactly where that money is coming from (i.e. from which financing sources) and where it’s going (i.e. who is receiving that money). In all cases, total sources must be equal total uses - which makes sense, since you only need to raise the exact amount of financing required to do the deal. Even if you raise more, and put that extra cash on the balance sheet, cash to balance sheet would be a use of the cash. The point is, cash doesn’t just vanish into thin air. It’s raised, and it’s used - period. Below is an example of a straightforward sources & uses schedule.

Easy right? I promise you it’s that simple. Even in more complicated deals, total sources = total uses. This simple rule is never broken. See below for the S&U for a more complicated transaction.
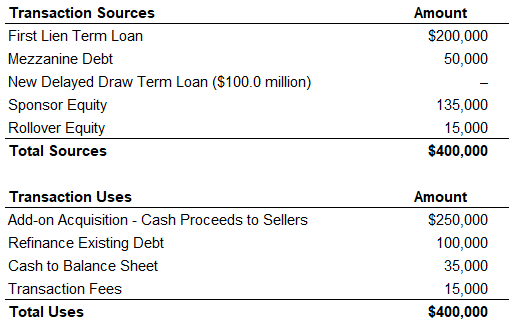
These schedules are typically one of the first you see in the model since they serve as a quick snapshot of what the contemplated deal actually entails. Along with the S&U, you’ll typically see a debt capitalization table, which demonstrates the capital structure at close - and which we’ll cover in this next section.
Capitalization Summary
The easiest way to think about a capitalization summary is to ask yourself “what does a snapshot of the company’s capital structure look like at close?” The capitalization summary is important because it outlines leverage at close, purchase price multiples, amount of equity in the business, what your loan-to-value is, etc. - all important structuring considerations on both the debt and equity side. Let’s take a look at the capitalization table for example #1 above:

Here we have a $40 million EBITDA business that is being acquired for $385 million - or around a 9.6x purchase price multiple. Including the $15 million of fees, you have $400 million of capital going into this business, which in this case is split 50/50 between the debt and equity (hence the 50% of cap for both debt and equity - which for the debt piece is essentially the loan-to-value). Now let’s take a look at example #2.

This one is a bit more complicated. For starters, the S&U show that this is an add-on acquisition for an existing portfolio company (the add-on purchase price was noted in the transaction uses). So there must already be an existing deal in place when the sponsor initially bought the business - and that existing deal doesn’t show up in the S&U, since we’re outlining the new deal. In this case I made some assumptions for clarity, but typically you would receive this info from the sponsor.
Highlighted in red are the financing sources for the new deal - these tie out to the S&U. The debt and equity financing raised for this add-on are then layered onto the existing capital structure of the business to create a “pro forma” view, which is the post-close capital structure. Remember, the existing debt and equity doesn’t vanish - instead, the new capital is layered into the business.
The final nuance here is the cash balance - cash is typically netted out of debt balances when calculating leverage/covenants, so we do the same when showing leverage in the capitalization table (note: this will be firm-specific, some like to see gross debt/leverage as well excluding the cash balance). In this case, $450 million of debt on an $80 million EBITDA company would be 5.6x gross, or 5.2x (net of the $35 million of balance sheet cash). That 5.2x net multiple is what we’re showing in the capitalization table above. Also note that we’re showing different leverage multiples for the Term Loan and Mezz debt, since the mezz is likely subordinated to the Term Loan. So here you’re levered at 4.6x on a senior-only basis and 5.2x on a total basis (i.e. including the mezz).
Believe it or not, it can get even messier than this. Luckily, most of the time it’ll be the straightforward “we’re buying a business and using debt and equity to finance it” which essentially is example #1 above.
That’s all for today - like I said, this was a quick introduction of one of the more straightforward LBO topics. We’ll dive into more advanced modeling in future posts.
If you enjoyed today’s post, the best way to support us is to share our page with your friends/colleagues to spread the word. Also consider becoming a subscriber (it’s free!) to never miss a post. If you are already a subscriber, consider upgrading to paid to support the team.
-OLB